
Spectroscopy
 When an organic chemist confronted with an unknown compound, he sets out to find the answer to the question : what is this? There are so many steps for the identification of the organic compounds; determination of molecular weight and molecular formula; detection of the presence or absence of certain functional groups; degradation to simpler compounds; conversion into derivatives. Nowadays the modern instruments help us to see more clearly the new things we shall met, and to recognize them more readily when we encounter them again.
The structures of the organic compounds can be readily found out by spectroscopy methods using the instruments called spectrometers. The organic spectroscopy is the study of how photons are absorbed by organic molecules. There is a relationship between the molecular structure and the type of the the photons' absorbance. By studying this relationship informations can be obtained about the molecules.

- The Mass Spectroscopy
- The Electromagnetic Spectrum
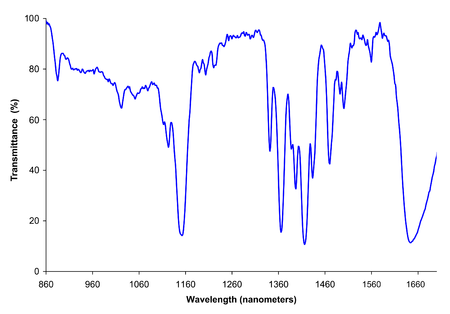
- The Infrared Spectroscopy
- The Visible and the Ultraviolet Spectroscopy
- The Nuclear Magnetic Resonance (NMR) Spectrum
- NMR Number of Signals
- NMR Chemical Shift
- NMR Peak Area and Proton Counting
- NMR Coupling Constants
- Carbon-13 NMR (CMR) Spectroscopy
- CMR Splitting
- CMR Chemical Shift
- The Electron Spin Resonance (ESR) Spectrum
 The mass spectrometer is used in this method. In here the molecules are bombarded with a beam of high energetic electrons, so that the molecules are ionized and broken up into many fragments, some of which are positive ions. Each type of ion posses its own ratio of mass to charge, or m/e value. for most of the ions the charge is 1, therefore m/e is the mass of the ion.
In the mass spectrometer, a signal is produced by the detector for each value of m/e ; the intensity of each signal provide us the relative abundance of the ion producing the signal. A plot showing the relative intensities of signals at the various m/e value is called a mass spectrum, which is highly characteristic for a particular compound. The largest peak is called as the Base Peak; its intensity taken as 100.
 |
| mass spectra of the Phenol |
 |
| mass spectra of 2-pentanol |
If we measure the mass spectrum of an unknown compound and find it to be identical with the spectrum of a previously reported compound, then we can end up with that (almost beyond the shadow of doubt) the two compounds are identical. There are two or more compounds can show identical physical properties; melting point, refractive index, boiling point, conductivity, etc.. but mass spectrum varies from one another.
 When an electron is removed from a molecule, it produces a parent ion or molecular ion; M+ whose m/e value is definitely, the molecular weight of that particular compound, because the charge is1.
In general most elements occur naturally as isotopes, so that the molecular weight that one usually measure and work with it is the average atomic weights of the element. But this is not for the molecular weight that is obtained from mass spectrum. Each isotope results a different peak in mass spectrum.
No comments:
Post a Comment